


.jpg)
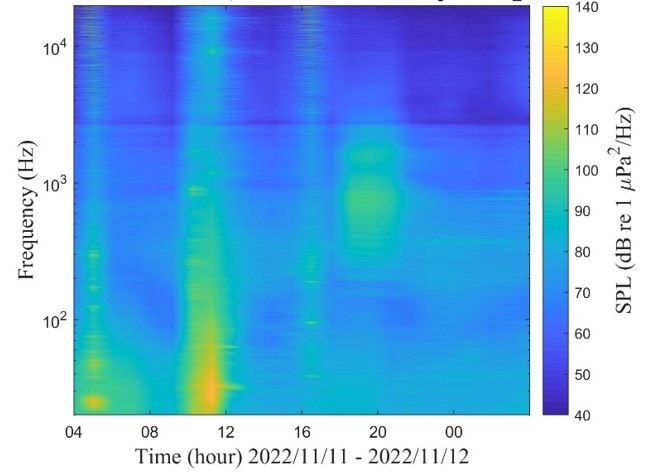
Fig.1 Example of spectrum diagram Fig.2 Example of probability distribution diagram
Carrying out measurements for the underwater background noise, biological noise, ship noise and construction noise with spectrum diagrams and probability distribution diagrams according to the needs of customers.
Understanding the noise generated in a specific period and other information through spectrum diagrams and trend of the noise generated in different frequency bands through probability distribution diagrams to analyze possible causes in this measurement period.
